POWER BI
"Innovate. Integrate. Inspire The Future with SoftCrayons"
Power BI Training With Certification is a fantastic tool for businesses looking to begin, organize or expand their business intelligence initiatives.
Unsurprisingly, the well-known Microsoft product has become an extremely sought-after platform for data analytics worldwide.
Learn, Build Skills, Grow Limitlessly. Your IT Career Starts Here.

Course Duration
3 month - 6 month

New Batch
As per schedule hybrid mode

Payment
Flexible One-Time/Installment

Mode
Flexible Offline/Online
Professional Skill Development
Service Details
Power BI Training With Certification is a fantastic tool for businesses looking to begin, organize or expand their business intelligence initiatives.
Unsurprisingly, the well-known Microsoft product has become an extremely sought-after platform for data analytics worldwide.
What Is It That Makes Power BI Training Certification In Ghaziabad Different?
Let's examine these benefits more in-depth.
When Used Properly, Power BI Can Give Everyone Access to Valuable Business Data
One of the most significant advantages of Power BI's platform is that it helps businesses create more of an environment driven by data. One that is data-driven is one in which all decisions are based on facts, not feelings or intuition.
Power BI helps companies accomplish this task more efficiently by providing business intelligence tools at the organization's disposal.
As a result, everyone in the company may make decisions based on up-to-the-minute data.
Power BI is currently available in two forms: Power BI Desktop and Power BI as a service. Power BI Desktop is free, meaning everyone in an organization can get and use it immediately.
Power BI Desktop lets users connect to data and build reports that feature rich visualizations.
The reports are eventually made available (as charts) on the web edition of Power BI, known as "the" Power BI service. It is within the Power BI service that reports are published.
Interactive Information Comes Alive With Power BI
Data is useful when it can provide valuable business insights and stories that aid decision-makers in making better choices.
One can use Power BI to transform data. The users can link their information to Power BI and choose from many different visualizations to share stories about their data to help gain and share knowledge.
Implementing such visualizations is a breeze, and Power BI Course Training capabilities let you drag and move visuals around to produce informative, clear, well-organized reports and dashboards.
Additionally, these visuals are interactive and interactive, which is an enormous advantage of Power BI.
Users can sort reports and dashboards and see their visualizations adapt and refresh in mere seconds based on their recently implemented filtering needs - all to gain more information from their information.
When Security is easily attainable by Power BI
Power BI has many security options that allow users to safeguard sensitive data and comply with different standards for Security and compliance.
Power BI Certification Course takes advantage of Microsoft's Cloud App Security feature, which "offers complete access into all of your Microsoft and third-party cloud services, complete command over data movement, and advanced analytics to detect and counteract cyber threats."
Power BI's sensitivity labelling makes it simple for administrators to inform consumers and users of sensitive information types that one should handle differently. The well-known Microsoft product also comes with encryption options that further protect information.
Finally, developers can use the row-level Security (RLS) features to design and assign roles to various users. This security feature dramatically benefits businesses with information only accessible to select employees (or groups of employees).
Allows for simple integration with a wide variety of databases.
I'm not planning to spend much time discussing this advantage of Power BI. The robust data analytics platform connects numerous data sources, from files with data like Excel and CSV to databases and online databases such as Salesforce and Adobe Analytics.
Power BI's integration with Excel is fantastic, allowing users to "easily [transfer] all of your current Excel queries, data models, and reports to Power BI--without learning a new application or language".
Attain Power BI Course has Artificial Intelligence Capabilities.
Power BI possesses artificial intelligence capabilities that let users benefit more from their data and reports. It provides three compelling AI visualizations that developers can employ to explore their data, gain insights, and discover trends that are difficult to locate.
Constantly Being Improved Because Of Its Best Features
Microsoft continues to pour its time and resources into Power BI, showing precise determination to make it among the world's top valuable and efficient data analytics platforms.
It is not uncommon to add new features to the tool while existing features are regularly altered and upgraded.
Excel at content dissemination with Power BI Apps
Apps that are part of Power BI are a convenient way for report writers to share Power BI content with consumers in any way, be it in large numbers, an entire business, or just one individual.
The benefits of Power BI apps firsthand throughout our work as consultants. We recently helped a substantial retail company make the most from this function.
After aiding our clients to enhance their data, adopt Power BI, and generate unique dashboards and reports, we helped them build a robust Power BI app to effectively communicate the Power BI Course Training Ghaziabad content with other employees.
The application has been a massive success, and the process has allowed our client to encourage creating and developing a culture based on data.
Power BI Certification Training in Ghaziabad: Advantages
Power BI course Training Ghaziabad is a business analytics software. Business intelligence is critical to be competitive, agile and productive. As businesses grow, they often face many challenges in keeping track of the data produced.
Trending Technologies Training Certification is a cloud-based solution that requires no cost of capital or infrastructure support, whatever the dimension of the business.
The most recent version of the software is free of the limitations of older software, and users don't require any specific instruction to create business intelligence data.
Type of all Microsoft cloud-based services, the installation of Power BI is rapid and easy. Being Power BI Training Certification provides unique advantages to your business. The benefits of this business analyst training make you a gift for your company.
Once you've earned your Power BI certification, you'll gain a wealth of knowledge that will allow you to perform tasks such as:
Transforming data using Power BI
Desktop involves joining data sources, making transformations, and cleaning the data.
Modeling and Visualizing Data
It equips you with the knowledge to develop custom or improve existing data models, resulting in calculated columns and tables that measure every employee's performance using gauges, KPIs and cards.
It also helps in creating organizational hierarchies and helps in managing custom-designed reporting tools.
Configure Dashboards Reports And Apps
It teaches you how to set up a dashboard to create and publish reports. Additionally, it teaches the knowledge required to set up security settings for dashboards, apps, and notices.
When you've earned your Power BI certification Course in Ghaziabad, you will know how to set up applications and workspaces for apps.
Other benefits that come with the Power BI Training Certification include:
There are no speed and memory limitations. Moving a current BI system to a solid cloud-based environment using Power BI integrated eliminates memory and speed constraints, ensuring data retrieval is speedily and then analyzed.
Power BI tools can seamlessly integrate with cloud services with advanced features such as Cortana and the Bot framework. Therefore, it will provide the query results for data spoken through natural language.
No technical expertise is required. Power BI delivers agile inquiry and analysis without the requirement for technical help. It has a robust natural language interface, as well as the use of visual design tools.
The ability to extract business intelligence quickly and precisely - It assists in transforming your company's data into stunning visuals, thereby collecting business intelligence for better decision-making.
Illustrations of Power BI Training Course In Ghaziabad
Due to the power of Power BI, it can be used in various ways by companies.
Since it's a data-centric tool, It's an excellent instrument for companies that deal with complex amounts of data.
Based on this information, business leaders can make better-informed decisions about allocating resources.
These are just a few other examples of Power BI being used to help businesses.
Sales teams can use data visualization to measure their sales teams' progress over time.
Dashboards allow managers to track several teams' progress simultaneously and see the team's actions in one glance.
Ad-hoc analysis is easy for data analysts with Power BI because you can analyze data without relying on IT or other staff members for technical problems.
Marketers can use Power BI to monitor their pipeline of sales leads and lead generation.
Product managers can quickly monitor the key metrics affecting the product's performance through dashboards and Power BI visualizations.
Finance departments can gain insight into how they function with the help of receivables, accounts payable, and inventory management information.
Power BI Training Certification in Business has increased in importance over time since it's being utilized for data visualization by professionals in the business to gain insights into the performance of their companies.
Softcrayons is the best IT Training Institute in Ghaziabad. So Take admission in the best Courses and attain IT Training Certification now.
Training Features
Live Interactive Classes
Real-time doubt clearing with expert instructors
Hands-on Projects
Build portfolio with industry-standard projects
Industry Curriculum
Updated syllabus matching current job requirements
Latest Technologies
Learn cutting-edge tools and frameworks
Online & Offline
Flexible learning modes to suit your schedule
Certification Support
Prepare for global IT certifications
LEARNING PATH
Master the Syllabus
Program Highlights

Top Faculty with Certification Facility
Learn from the best, as we impart world-class education with faculty who have rich academic & industry experience

Career Service: Job Readiness
Pursuing your desire to being job-ready through resume building sessions & MasterClass for interview preparation

Choose the way you want to learn
Enhance your learning potential by your choice of printed books, audio books, e-books, videos, and live classrooms

Placement Guarantee
Benefit from our network of over 500+ hiring partners from diverse domains to ensure a smooth job transition after 1 year
Common Questions
Power BI is a business analytics tool by Microsoft that helps visualize data and share insights across an organization. Learning Power BI enhances your data analysis, reporting, and decision-making skills, making you highly valuable in data-driven industries.
No prior knowledge of Power BI is required. However, having basic knowledge of Excel, databases, or data analysis concepts will be helpful.
Yes, the training includes practical exercises, real-time projects, and case studies to help you gain hands-on experience with Power BI.
Yes, the course is designed for beginners as well as professionals who want to upgrade their data visualization and business intelligence skills.
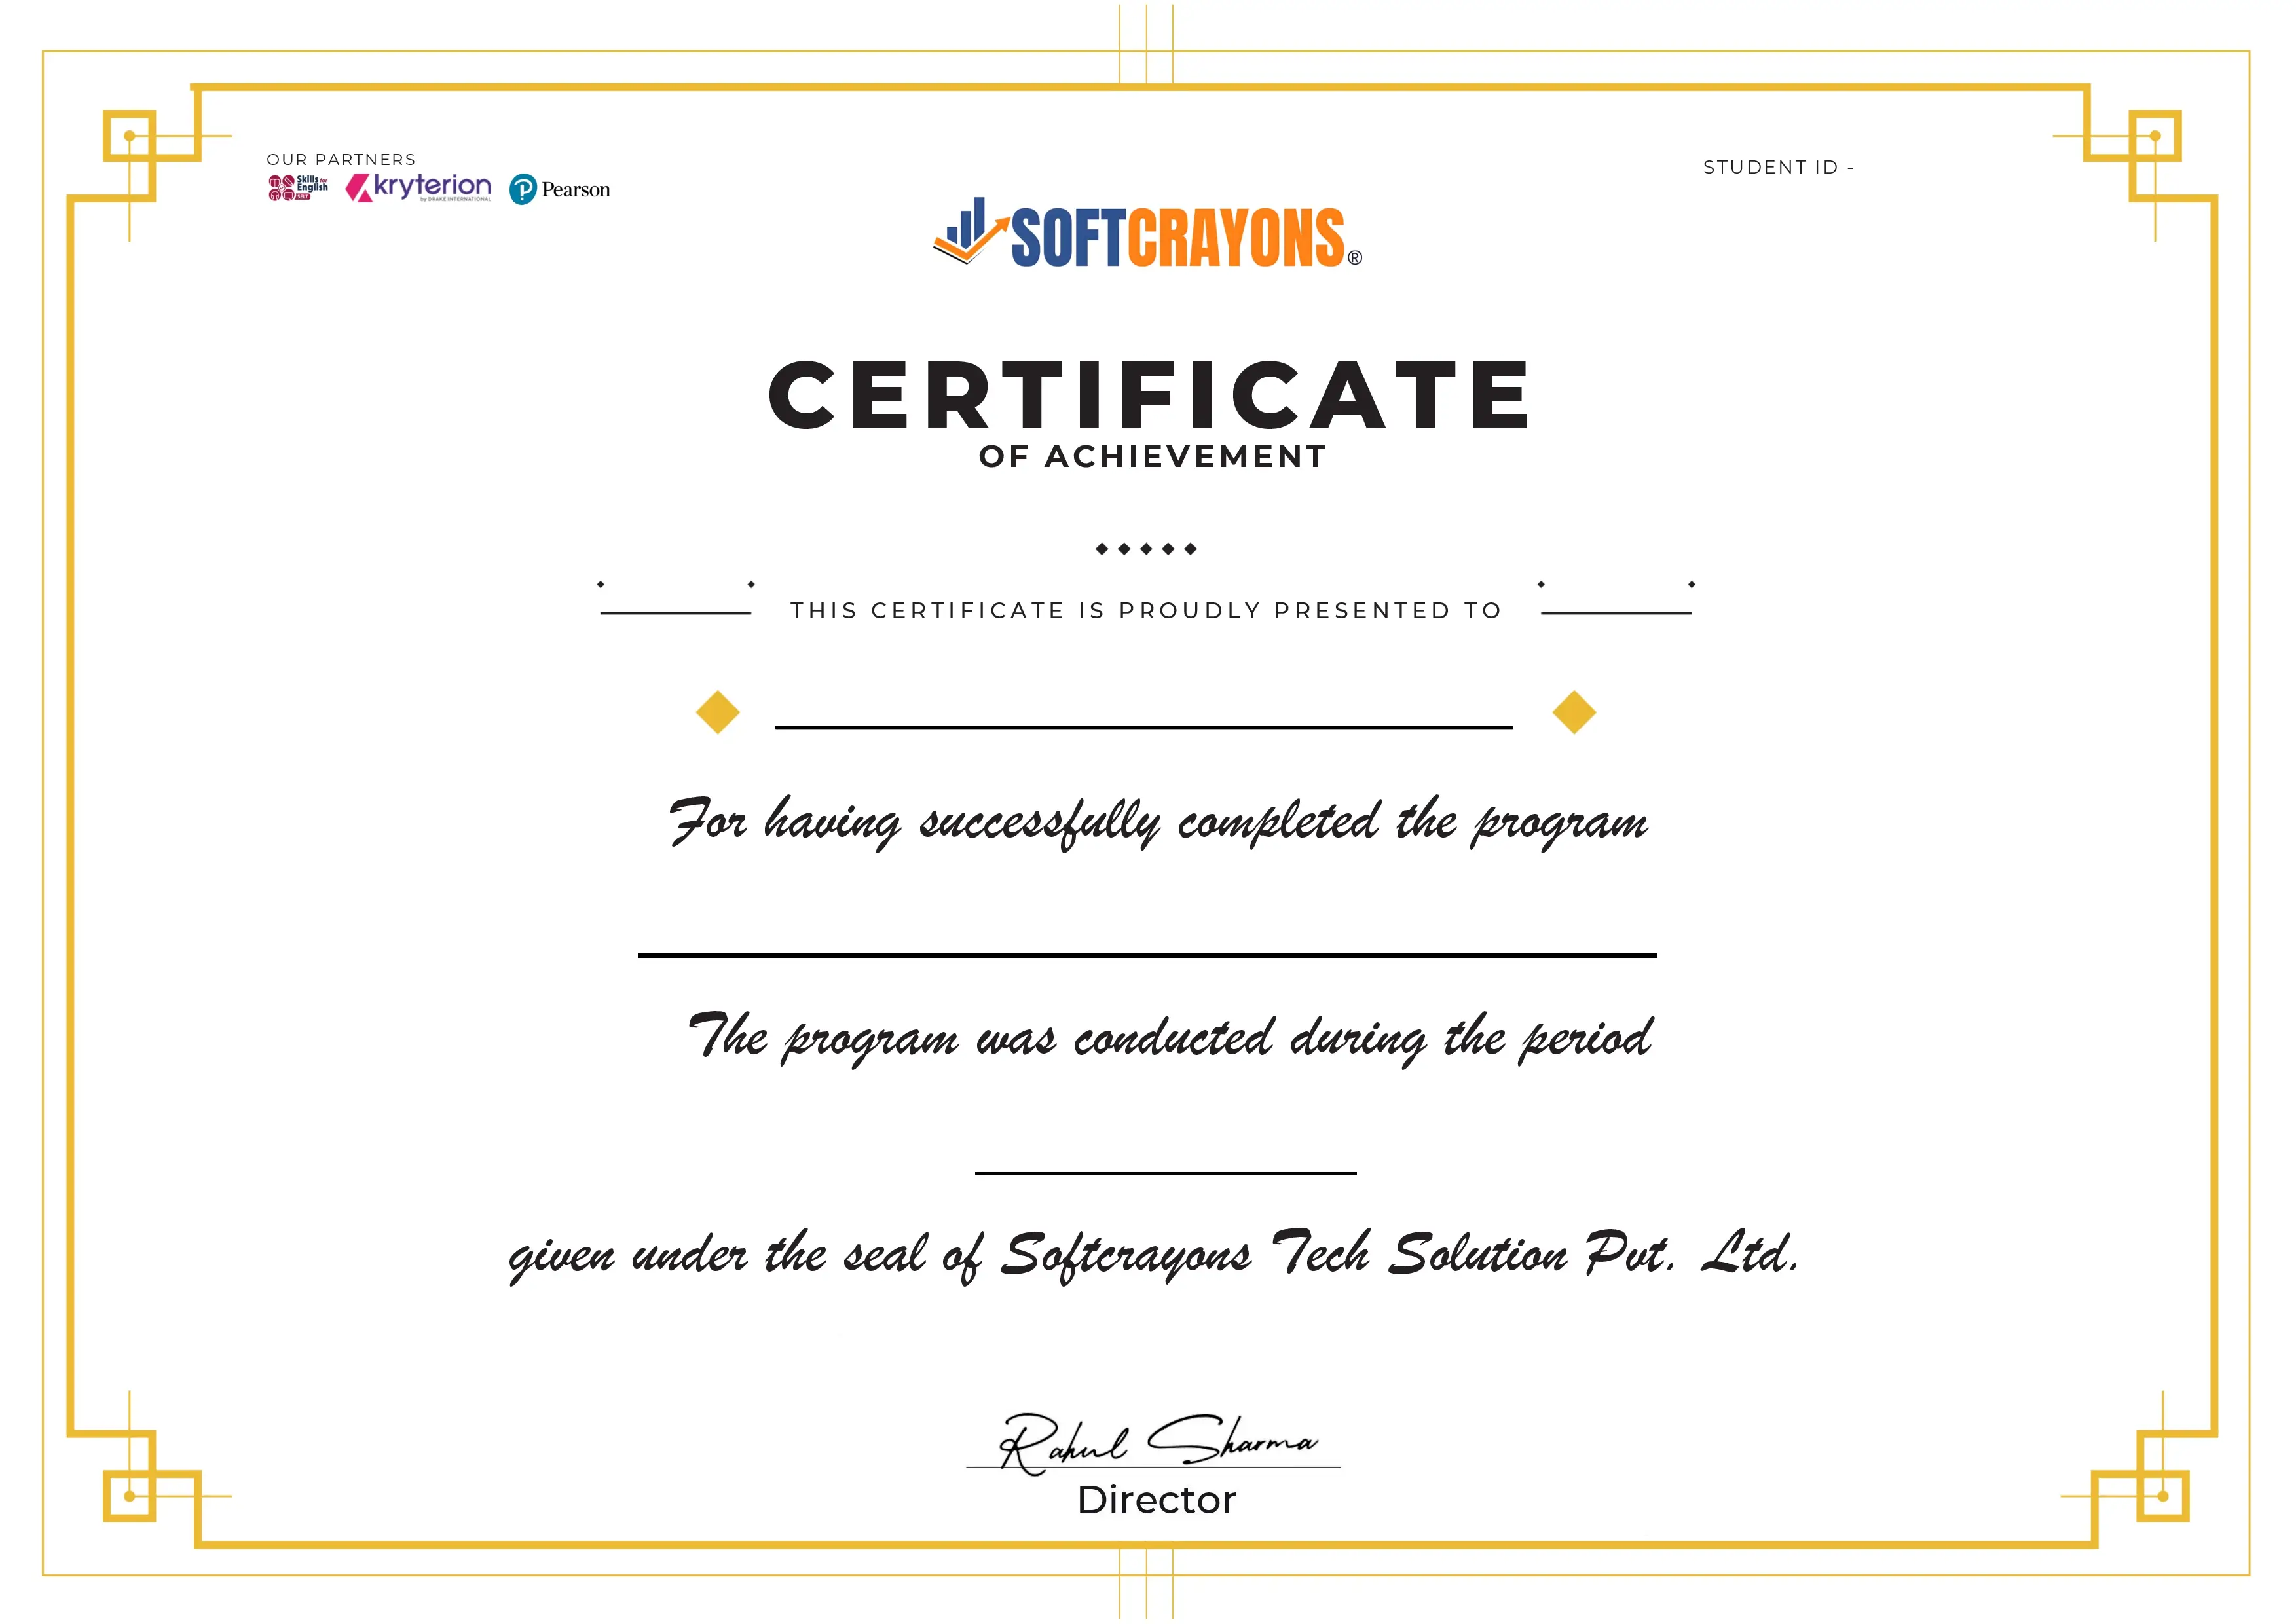
Upon successful completion of the program, your certificate will be emailed to you in a digital format.
Yes, the training covers DAX (Data Analysis Expressions) in detail, including calculated columns, measures, and advanced time intelligence functions.
Yes, we offer placement assistance, resume-building guidance, and interview preparation support for students completing the program.
You will work on real-world business scenarios involving data extraction, transformation, visualization, and creating interactive dashboards.
Join Our Power BI
Guranteed Job Placement Program
- Expert-led training
- Hands-on projects
- Globally recognized certification
Training Certification
🎓 Earn Your Certificate
Successfully complete the training and assessments to receive your official certification. This credential validates your skills and enhances your career opportunities.
Showcase your achievements and share your milestones with your network to inspire others and grow your professional connections.

Interested in this Program? Secure your spot now!
Upcoming Batches
Interested in this Program? Secure your spot now!
What People Say About Us
Himanshu Tyagi
I have completed the course in 3-4 months of DIGITAL MARKETING training under the guidance of Experts Trainers. It was the best experience to learn under them and their teaching methods are out of the box. Best institute for professional courses and a great place. and very cooperative company with helpful staff.
Related Courses


